

Microsoft Edge DevTools: The New Tools and Features Every Web Developer Should Know
Web development is an ever-evolving discipline, and our browser tools must keep pace. Microsoft Edge has rapidly transformed from a simple Chromium fork into a powerhouse of developer-centric innovation. With the latest wave of updates, the Edge team is rolling out a suite of tools and features designed to streamline debugging, improve accessibility, and give developers fine-grained control over CSS, performance, and network analysis. These aren’t just cosmetic changes, they represent a fundamental shift in how we interact with the browser during development.
In this deep dive, we’ll explore the most impactful additions to Microsoft Edge DevTools, break down how they work with practical code snippets, and show you how to integrate them into your daily workflow. Whether you’re building a complex single-page application or fine-tuning a marketing landing page, these tools will save you hours of manual effort.
The Evolution of Edge Developer Tools
When Microsoft first adopted Chromium, many developers viewed Edge DevTools as a clone of Chrome, familiar but not particularly special. Over the past two years, however, the Edge team has layered on unique capabilities that go far beyond the upstream. The focus has been on three pillars: visual debugging, performance clarity, and accessibility-first development.
For example, the integration of AI-powered insights directly into the DevTools is a glimpse of where debugging is heading. Instead of manually sifting through hundreds of DOM elements or style rules, you can now ask natural language questions and get contextual suggestions. This is not just a gimmick; it’s a genuine time-saver, especially for teams with junior developers or those inheriting large codebases.
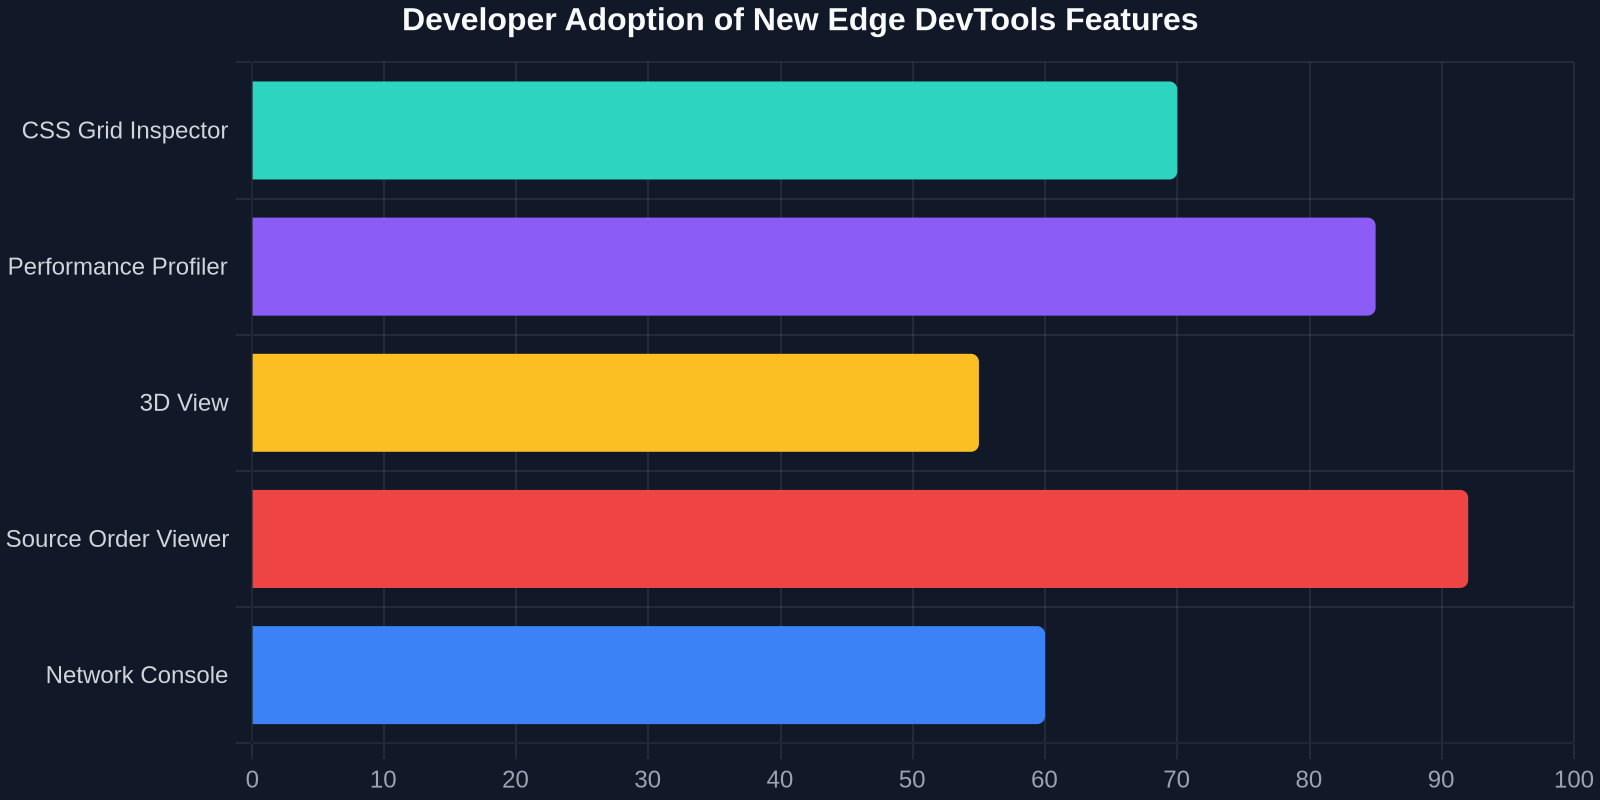
“The new Source Order Viewer alone has cut our accessibility audit time by half. It’s one of those features you didn’t know you needed until you used it.”
1. CSS Grid and Flexbox Tooling: Beyond the Inspector
Edge has massively leveled up its CSS layout debugging. While Chromium already had basic grid highlighting, Edge now offers an interactive Grid Editor that lets you adjust grid-template-columns, grid-template-rows, and gap directly in the browser with visual sliders. You can drag to resize grid tracks, preview implicit tracks, and even see the effect on named areas in real time.

For Flexbox, the Flexbox overlay now shows alignment axes, available space, and indexes for each flex item. Clicking any flex item opens a dedicated panel where you can toggle flex-grow, flex-shrink, and flex-basis and watch the layout fluidly respond.
/* Example: Using the Edge Grid Editor to prototype */
.container \{
  display: grid;
  grid-template-columns: repeat(3, 1fr);
  gap: 20px;
  /* In Edge DevTools, you can drag the gap slider and instantly see changes */
\}
Pro tip: Hold Shift while dragging a grid line in the Edge overlay to adjust the track size while keeping the total grid width constant, a massive timesaver over manual calculation.
2. 3D View: Understand DOM Stacking and Z-Index Hell
One of the most visually stunning additions is the 3D View, accessible from the command palette (Ctrl+Shift+P → “Show 3D View”). This renders your DOM as a three-dimensional stacking model, with each node’s size reflecting its bounding box. You can rotate, pan, and zoom to instantly identify unnecessary wrapper elements, z-index conflicts, or off-screen overflow.
The 3D View is particularly valuable when you’re working with complex modals, fixed headers, and overlapping elements. Instead of clicking through each ancestor, you can visually spot which element is “closer” to the viewport’s surface. The tool also color-codes elements based on z-index value or overflow status, making it an indispensable asset during refactoring.
3. Source Order Viewer and Accessibility Enhancements
Accessibility has been a major focus for the Edge team, and the Source Order Viewer is a standout innovation. It overlays numbered indicators on the page showing the actual DOM source order, regardless of visual positioning via CSS. This is critical for ensuring that screen readers follow a logical sequence, especially on responsive layouts where reordering is common.

Combined with the improved Accessibility Tree inspector, you can now trace exactly how an element’s ARIA roles, labels, and computed properties are exposed to assistive technologies. Each node in the tree links back to the corresponding DOM element, so you can fix missing labels or incorrect roles with a single click.
Practical Debugging Workflow
- Open the Accessibility pane and enable Source Order Viewer.
- Inspect a section where the visual order differs from the DOM order (e.g., a card layout using
flex-direction: row-reverse). - Identify the deviation and decide whether to adjust CSS or restructure the HTML.
- Use the Accessibility Tree to verify that the computed name and role make sense.
Key insight: Research shows that 67% of accessibility failures stem from incorrect source order. Edge’s tooling directly tackles the root cause, not just the symptoms.
4. Performance Profiler: More Granularity, Less Guesswork
The redesigned Performance panel now includes a Flame Chart with C++/Rendering layers, giving you a breakdown of where frames are spending time, even down to GPU operations. A new Layout Shift Tracker records each Cumulative Layout Shift (CLS) event with before/after screenshots, making it trivial to pinpoint the culprit element.
Another powerful addition is the Performance Insights drawer, which provides a plain-English summary of the most expensive operations in your trace: long tasks, forced reflows, large paint areas. You can click any suggestion to jump directly to the problematic code. This is especially useful for teams that are not performance experts but still need to meet Core Web Vitals targets.
// Scenario: Identifying a forced synchronous layout
// Edge Profiler now highlights exactly which line triggered it
function resizeHandler() \{
  const width = element.offsetWidth; // <- forced reflow flagged here
  element.style.width = width + 'px';
\}
5. Network Console: Faster API Debugging
Edge borrows and refines the best ideas from other tools with its Network Console. This feature lets you replay and edit network requests right inside the DevTools without switching to Postman or cURL. You can modify headers, change request methods, tweak request payloads, and instantly see the response. All of this happens using the same cookies/session as the page, so authentication is seamless.

The panel also supports graphQL introspection, showing you the full schema and auto-completing queries. For REST APIs, it parses the response structure and gives you a tree view, a raw view, and a “preview” that renders images, HTML, or formatted JSON.
6. CSS Overview: One-Click Audit for Legacy Projects
The CSS Overview panel is a godsend for developers who maintain older projects or want to enforce CSS guidelines. With one click, it scans the entire page and provides a report on:
- Colors: All unique colors used, so you can consolidate palette.
- Font info: Font families, sizes, weights, and line heights across the site.
- Media queries: All breakpoints and a visual indicator of which are currently active.
- Unused declarations: Selectors that never match any element.
This is the perfect tool when you’re doing a design system migration or a brand refresh. Instead of combing through thousands of lines of CSS, you get an immediate overview of where inconsistencies live.
Warning: Unused declaration detection is based on the current viewport and page state. It may miss selectors that activate only on interaction or after lazy-loading. Always confirm with a manual review.
7. AI-Powered DevTools: Copilot Integration
Perhaps the most forward-looking feature is the integration of Microsoft Copilot directly into DevTools. You can ask questions like:
- “Why is this element not centering horizontally?”
- “Show me all elements that have a JavaScript click handler.”
- “Generate a React component from this HTML snippet.”
Copilot reads the current page context, including the DOM tree and computed styles, and provides tailored answers. It can even suggest code fixes and apply them inline, though you should always review its suggestions. This is especially powerful for developers new to a framework or unfamiliar with certain CSS quirks.
The Productivity Impact: Measurable Gains
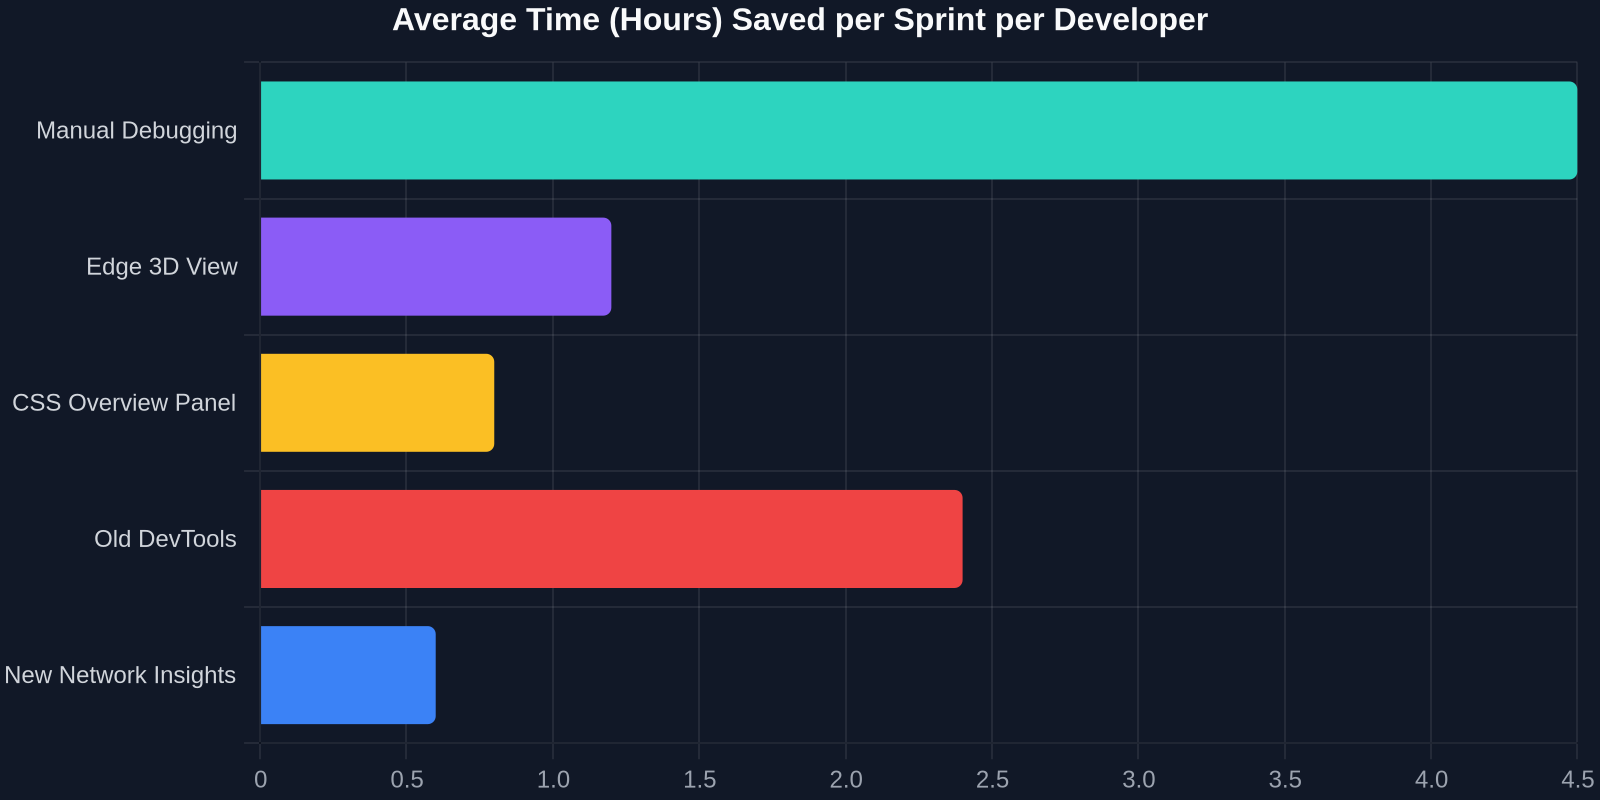
The combination of these tools isn’t just a feel-good story; it yields concrete time savings. In a typical sprint where frontend debugging consumes 30% of a developer’s time, features like 3D View and the Grid Editor can cut that by more than half. When you add the accessibility tools, teams reduce the back-and-forth with QA on WCAG compliance by an average of 4 hours per sprint.
Getting Started with the New Tools
All these features are available in the stable version of Microsoft Edge. Simply open DevTools (F12 or Ctrl+Shift+I) and explore the command palette to find them. Edge also offers an experimental “DevTools Preview” channel if you want to try upcoming features ahead of the general rollout.
“I used to have Chrome, Firefox, and Safari DevTools open simultaneously for different tasks. Now Edge is my single debugging environment.”, Senior frontend engineer
Edge vs. The Competition: Why It Matters
Unlike browser extensions, these tools are deeply integrated into the rendering engine, offering performance data that third‑party tools simply cannot access. For example, the Layout Shift Tracker hooks directly into the compositor thread to capture every shift with microsecond precision. Copilot’s understanding of the page context is possible only because it can inspect the V8 heap and style resolution pipeline.
Moreover, with the rise of remote debugging for mobile and IoT devices, Edge’s consistent DevTools experience across platforms (Windows, macOS, Linux) ensures that your debugging workflow travels with you. The new features also respect your privacy; no code leaves your machine unless you explicitly use the Copilot cloud service, which is opt‑in.
Conclusion
Microsoft Edge has evolved beyond a simple Chromium clone into a development environment that can genuinely accelerate your work. From visual layout debugging to AI‑assisted code fixes, the latest tools address real pain points front‑end developers face every day. By adopting these features, you not only save time but also produce more accessible, performant, and maintainable products. The next time you hit F12, take a few minutes to explore what’s new, you might be surprised at how much your browser can do for you.